This topic includes:
The History view presents sensor values, sensor value events, and status messages of devices and their sensors graphically over time.
In order to record data over time and make data progression visible in the History view, several requirements need to be met:
1] A MADRIX KEY with a valid MADRIX RADAR big data license needs to be connected to the software.
Learn more »License System
2] PostgreSQL Server needs to be set up as database management system.
Learn more »Database
3] The Store History settings need to be activated in the Options.
Learn more »Generators
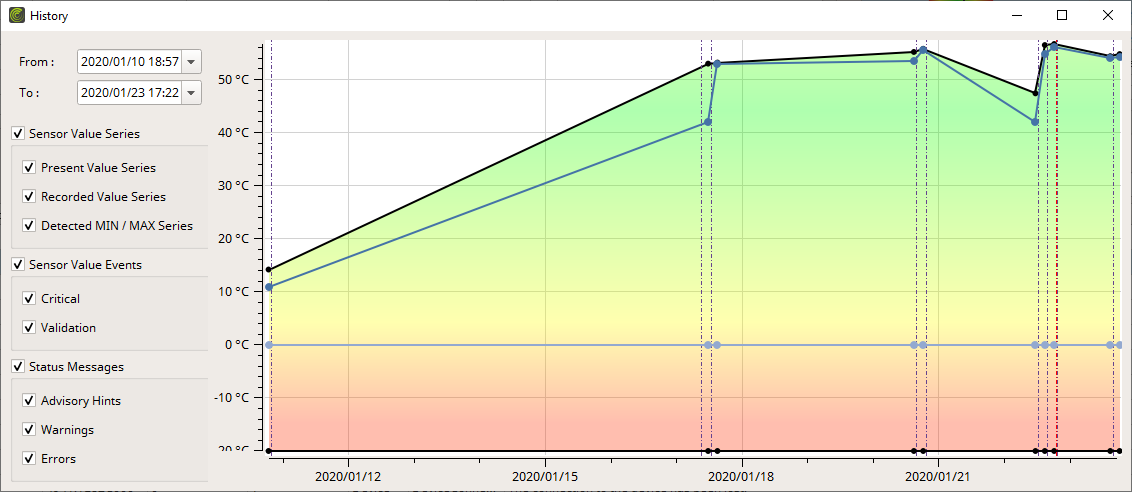
From |
Allows you to define the exact beginning of the time interval that is shown as data graph. |
To |
Allows you to define the exact end of the time interval that is shown as data graph. |
Sensor Values Series |
Shows or hides all recorded sensor values. |
Present Value Series |
Shows or hides all sensor values that were received based on regular RDM requests sent to the devices. Learn more »Timing |
Recorded Values Series |
Shows or hides all sensor values that were recorded by a device itself. A device needs to support this feature. Learn more »Sensors |
Detected MIN/MAX Series |
Shows or hides all Min/Max Detected sensor values, which are the lowest or highest values ever recorded for a sensor. A device needs to support this feature. |
Sensor Value Events |
Shows or hides all reported sensor value events. |
Critical |
Shows or hides all critical sensor value events. |
Validation |
Shows or hides all validation sensor value events. |
Status Messages |
Shows or hides all recorded status messages of the device. |
Advisory Hints |
Shows or hides all advisory status messages. |
Warnings |
Shows or hides all warning status messages. |
Errors |
Shows or hides all error status messages. |
You can easily navigate within the data graphs and adjust the view according to your needs.
Left Mouse Click + Hold + Move |
Allows you to move freely along the X-axis and Y-axis. |
Mouse Wheel |
Quickly zooms in and out in order to narrow or enlarge the shown time interval. This determines the level of detail. Zooming in or out may group several data points, status messages, or events into one data point in order to declutter the graph. The tooltip will then include all items combined. |
Ctrl + Mouse Wheel |
Activates only the horizontal zoom and scales only along the X-axis. |
Ctrl + Shift + Mouse Wheel |
Activates only the vertical zoom and scales only along the Y-axis. |
▪Right Mouse Click - Perform a click with your right mouse button on an entry.
Fit Plot To Viewport |
Automatically defines a sensible scale of the X-axis [time interval] and Y-axis [unit] according to the recorded data that is currently shown. |
▪In order to show historical data, you first need to
- Select a single device [in the Devices View].
and
- Select a single sensor of this specific device [in the Sensors View].
▪The following data will then be shown:
- Sensor values of the selected sensor.
- Sensor value events of the selected sensor.
- Status messages of the selected device.
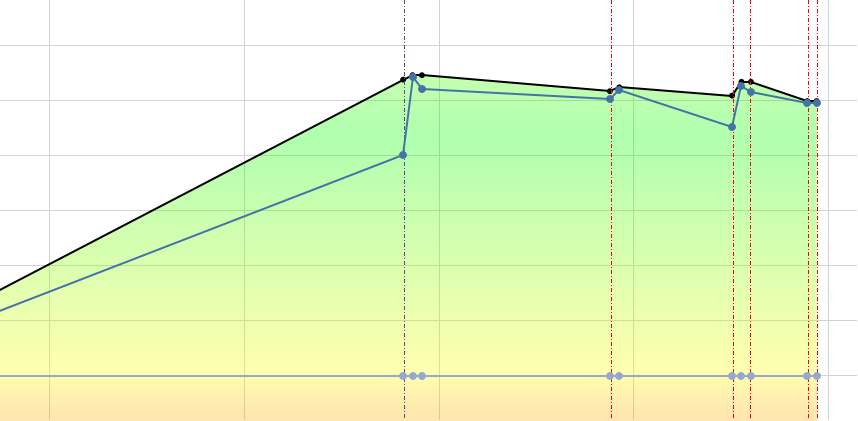
▪Present Values will be shown as blue line [trend line] with blue dots [recorded data points].
▪Recorded Values will be shown as gray line [trend line] with gray dots [recorded data points].
▪MIN/MAX Values will be shown as black line [trend line] with black dots [recorded data points].
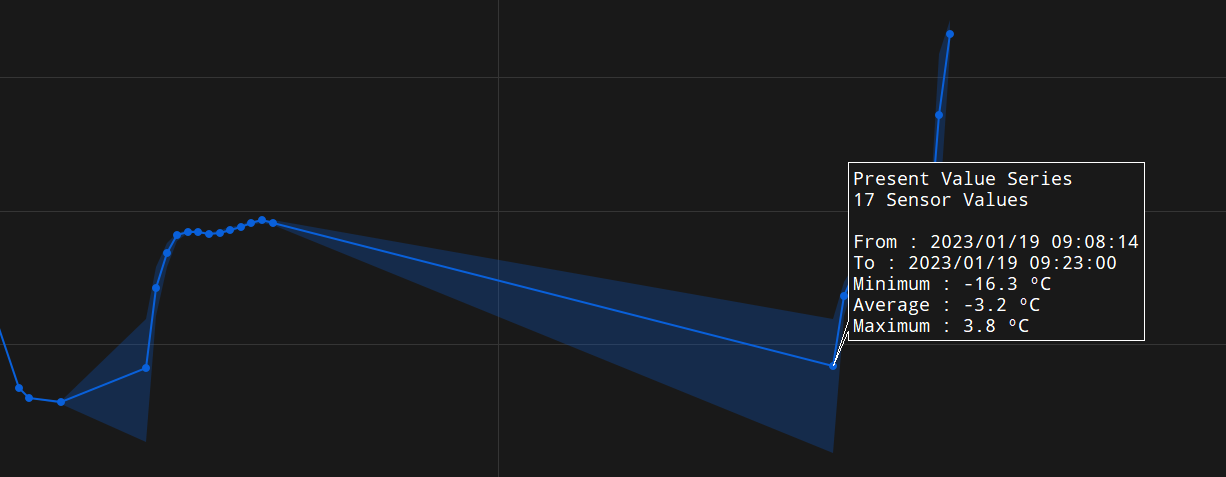
- Mouse-Over - Hover with you mouse over such a dot and MADRIX RADAR will show a tooltip that includes the timestamp as well as the sensor value.
- If a data point includes several sensor values, the average will be calculated for Momentary Values as well as Recorded Values.
- A gradient [red-orange-yellow-green] will be drawn between value minimums and maximum and therefore include a helpful graphical representation of the current status. Learn more »Sensors
- If several sensor values have been condensed into single data points according to a farther zoom level, the minimum and maximum values are then shown as a helpful blue background in order to better assess the averaged values.
▪Sensor value events will be shown as dashed/dotted, vertical lines:
- In purple.
- Mouse-Over - Hover with you mouse over such a line and MADRIX RADAR will show a tooltip that includes the timestamp [YYYY/MM/DD HH:MM:SS], value, as well as the event.
▪Status messages will be shown as dashed/dotted, vertical lines:
- Category Advisory is shown in white.
- Category Warning is shown in yellow.
- Category Error is shown in red.
- Mouse-Over - Hover with you mouse over such a line and MADRIX RADAR will show a tooltip that includes the timestamp [YYYY/MM/DD HH:MM:SS] as well as the status message.
▪The X-axis represents the timeline with time intervals.
▪The Y-axis represents the unit of the sensor value [such as °C for temperatures].