This topic includes:
MADRIX RADAR sends and receives requests from connected RDM devices, which include valuable information, such as sensor values.
In addition to merely requesting and receiving information, MADRIX RADAR will apply its own logic in order to create events for you. By checking and validating incoming data, MADRIX RADAR provides actionable reports for you.
This functionality is not part of the RDM specification and provides great additional value when using MADRIX RADAR. As such, it is an important tool for monitoring and supervising the project.
You can choose to show events only in the software itself, or set up custom notifications according to your requirements [see the next chapter].
The Events view shows all occurred events from all RDM devices.
In general, please allow for several minutes of time to pass before events are registered and shown.
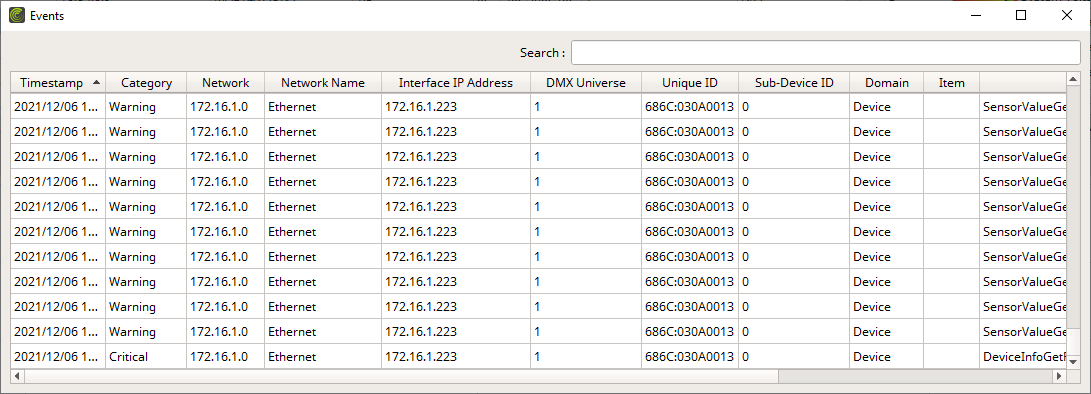
By default, the following information is provided since the following columns are enabled in the list:
Timestamp |
Shows the local time when the event occurred. [YYYY/MM/DD HH:MM:SS] |
Category |
Shows the kind of event [including Info, Warning, Critical, Fatal]. |
Network |
Shows the network IP address of the network adapter, to which the interface is connected. [TCP/IPv4] [This information refers to »Art-Net.] |
Network Name |
Shows the name of the network adapter. |
Interface IP Address |
Shows the IP address of the hardware interface to which the RDM device is connected. [This information refers to »Art-Net.] |
Interface Short Name |
Shows the short name of the hardware interface to which the RDM device is connected. [This information refers to »Art-Net.] |
Interface Long Name |
Shows the long name of the hardware interface to which the RDM device is connected. [This information refers to »Art-Net.] |
DMX Universe |
Shows the currently assigned DMX universe for the RDM device. [Learn more »Glossary] |
Unique ID |
Is also shown in the Devices view. Represents a unique identifier of the RDM device. It is shown as HEX [without 0x] and using a colon [:] as separator. The first part is the ESTA ID of the manufacturer and the second part is a number, which can be freely defined by the manufacturer. |
Sub-Device ID |
Shows a value of 0 if the device is a so-called root device. For all others, the sub-device ID for devices that have one is shown. |
Domain |
Shows to which type entry is assigned to, such as Devices. |
Item |
Shows a specific reference of where the event occurred if available. |
Label |
Shows the quick identifier of the specific event. |
Description |
Shows an in-depth explanation of the event for your information and as basis to act upon. |
▪All events will be logged.
▪Events are stored temporarily. They are shown until the software is closed.
▪In addition, events referring to history data will be stored persistently in the database and shown in the History View [Sensor Value Events].
▪A maximum of 1,000 entries can be shown.
▪Right Mouse Click - Perform a click with your right mouse button on an entry.
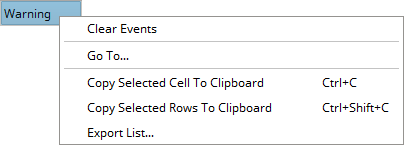
Go To... |
Focuses on the corresponding device in the Devices view, the corresponding interface in the Interfaces view, and also shows the event in the History view if recorded data is available. |
Clear Events |
Removes all logged items from the list. |
Copy Cell To Clipboard |
Copies the currently selected cell [that is, single information] into the clipboard/temporary memory. [Keyboard shortcut: Ctrl + C] |
Copy Rows To Clipboard |
Copies the currently selected line or lines [that is, all parameter information] into the clipboard/temporary memory. [Keyboard shortcut: Ctrl + Shift + C] |
Export List... |
Saves the entire, currently shown list/view/table as a preformatted text file. |

▪Search - Enter any text in order to search all parameters in the list.
- Any device/line that includes the search term will be shown. All others are temporarily filtered out.
- Terms can be case-insensitive. You don't have to use capital letters.
- Feel free to use terms that are incomplete. For example, mad will include results for MADRIX.
- You may specify certain columns by using a colon [:].
- For example: Desc:Vol shows all lines that include voltage status information by referencing the column Description, for example.
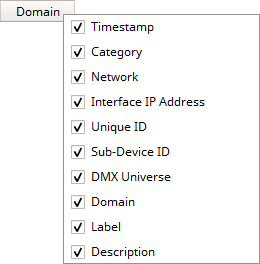
MADRIX RADAR allows you to choose which columns are presented in this view. You can decide which columns are hidden or shown.
▪Right Mouse Click - Perform a click with your right mouse button anywhere on the header of the list.
|
Shown - A checkmark means that columns are shown. |
|
Hidden - No checkmark means that columns are hidden. |
Timestamp |
Shows or hides the Timestamp column. |
Category |
Shows or hides the Category column. |
Network |
Shows or hides the Network column. |
Interface IP Address |
Shows or hides the Interface IP Address column. |
Unique ID |
Shows or hides the Unique ID column. |
Sub-Device Id |
Shows or hides the Sub-Device ID column. |
DMX Universe |
Shows or hides the DMX Universe column. |
Domain |
Shows or hides the Domain column. |
Label |
Shows or hides the Label column. |
Description |
Shows or hides the Description column. |
Resize All Columns To Content |
Automatically adjusts the width of all columns to be wider or smaller to comfortably fit all list entries as well as column headers. [This often means that the size of columns is reduced and more information can be displayed in the given space.] |


You can customize and set up if and how you would like to be notified in case of reported events.
Continue with »Event Notifications