This topic includes:
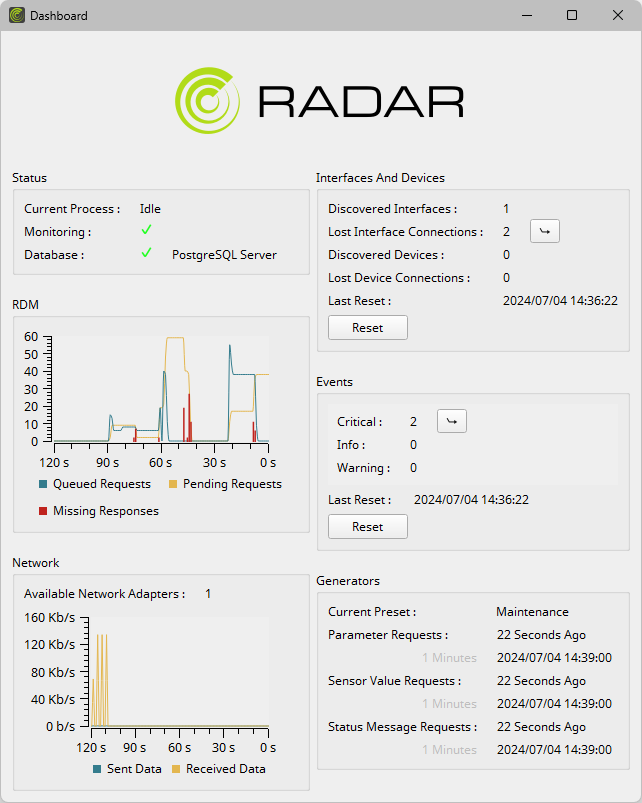
The Dashboard provides helpful insights into the software and the monitored system at a glance.
On the one hand, it shows the current status of MADRIX RADAR; that is what the software is currently doing.
On the other hand, the Dashboard shows the main system occurrences, since last you checked upon the system for example.
The Dashboard allows to quickly gain an overview over the system and any errors you may want to analyze further and check upon.
▪Go to the menu View > Dashboard
It is recommended to resize and enlarge this Dashboard window to see more information and move it to a second monitor if possible.
Status
Shows information about the current status of the software.
Current Process |
Shows the current tasks of the software. |
Monitoring |
Shows if the software is currently actively monitoring interfaces and RDM devices [green checkmark], or if monitoring has been paused [orange pause symbol]. |
Database |
Shows the currently set up database management system [SQLite In Main Memory, SQLite File, PostgreSQL Server] and if the connection to the database could be established successfully [green checkmark] or not [red cross]. |


RDM
Shows a graph about RDM packets, with number of requests [Y axis] and seconds past since then [X axis].
Queued Requests |
Shows if the software has sent out requests to interfaces and RDM devices [blue line]. |
Pending Requests |
Shows if the software is waiting for responses from interfaces or RDM devices to requests that have been sent out [yellow line]. |
Missing Responses |
Shows if the software has not received responses to its requests [red bars]. |
Network
Shows a graph about Ethernet network communication and its load, with data traffic [Y axis] and seconds past since then [X axis].
Available Network Adapters |
Shows the number of available network adapters/network cards in the computer system. |
Sent Data |
Shows how much data has been sent out [blue line]. |
Received Data |
Shows how much data has been received [yellow line]. |
Interfaces And Devices
Shows information about connected interfaces and RDM devices.
Note: Information shown here refers to 1] changes since the last reset of this information [see Last Reset] and 2] changes compared to the information stored in the database [for example, if your database already includes interfaces and RDM devices to which the connection has already been lost, they will not be reported in the Dashboard; only when the connection is established once more and/or lost again].
Discovered Interfaces |
Shows the number of newly discovered interfaces. |
Lost Interface Connections
|
Shows the number of interfaces to which the connection has been lost and is no longer established.
|
Discovered Devices |
Shows the number of newly discovered RDM devices. |
Lost Device Connections |
Shows the number of RDM devices to which the connection has been lost and is no longer established.
|
Last Reset |
Shows since when the above information has been collected. |
Events
Shows information about events that might have occurred.
Note: Information shown here refers to changes since the last reset of this information [see Last Reset].
Note: This area of information shows all categories that have been set up by you in the Event Configuration to show as Display By default, this includes Critical, Info, and Warning. Learn more »Event Notifications
Critical |
Shows the number of events that are set as critical.
|
Info |
Shows the number of events that are set as information.
|
Warning |
Shows the number of events that are set as warning.
|
... |
Shows any other category that has been set up by you in the Event Configuration to show as Display
|
Last Reset |
Shows since when the above information has been collected. |
Generators
MADRIX RADAR is designed to automatically send out requests to interfaces and RDM devices for you in order to monitor the system. The corresponding settings are configured in the Options »Generators
The Dashboard will show these settings at a glance and additional information.
Current Preset |
Shows if preset Maintenance or Monitoring is currently selected in the Options. |
Parameter Requests |
1] Shows how long ago parameters were requested last. |
Sensor Value Requests |
1] Shows how long ago sensor values were requested last. |
Status Message Requests |
1] Shows how long ago status messages were requested last. |