This topic includes:
The Sensors view shows all sensors that are available for the currently selected device or even currently selected devices.
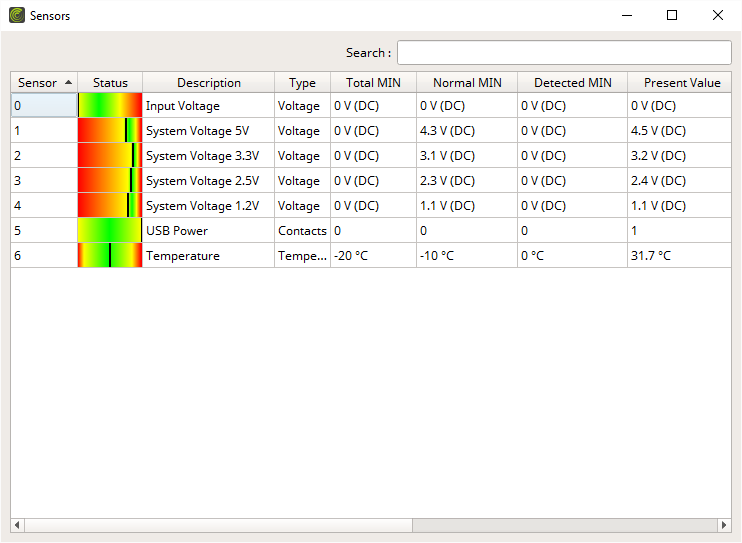
By default, the following information is provided since the following columns are enabled in the list:
Sensor |
Represents the sensor numbering and is especially useful for referencing sensors in the list. [As defined by the RDM standard, these start with the index 0.] |
Status |
Shows a helpful graphical representation of the sensor value. This includes: See also Visual Feedback |
Description |
Shows the name of the sensor [as reported by the device]. |
Type |
Shows the type of the sensor [as reported by the device]. |
Total MIN |
Shows the absolute minimum value the sensor can read and report [as defined by the sensor/manufacturer]. |
Normal MIN |
Shows the minimum sensor value, which is the lowest acceptable value for the device for normal operation. |
Detected MIN |
Shows the lowest sensor value that has been reported by the device. Please note that it depends on how the manufacturer has implemented this feature. The manufacturer decides what is being read and what is being reported and when. [The device needs to support the Recorded Value functionality as indicated by Recording Support.] |
Present Value |
Shows the current value of the sensor. |
Detected MAX |
Shows the highest sensor value that has been reported by the device. Please note that it depends on how the manufacturer has implemented this feature. The manufacturer decides what is being read and what is being reported and when. [The device needs to support the Recorded Value functionality as indicated by Recording Support.] |
Normal MAX |
Shows the maximum sensor value, which is the highest acceptable value for the device for normal operation. |
Total MAX |
Shows the absolute maximum value the sensor can read and report [as defined by the sensor/manufacturer]. |
Recorded Value |
Shows the currently recorded value [as reported by the device]. |
Recording Support |
Shows if the device supports this functionality. Devices can either support recording the current sensor value, detect and store minimum and maximum values, both recording and detecting, or none. |
▪Right Mouse Click - Perform a click with your right mouse button on an entry.
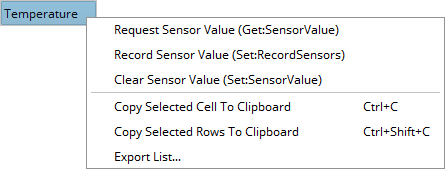
Request Sensor Values (Get:SensorValue) |
Requests up-to-date status information for the selected sensor. |
Record Sensor Values (Set:RecordSensors) |
Sends the RDM request Set:RecordSensors to the device in order to store the value in the device and request it via Get:SensorValue. This parameter can only be set. Its status cannot be received and thus it cannot be shown in the overview. This will record the current sensor value in the RDM device itself. |
Clear Sensor Values (Set:SensorValue) |
Sends the RDM request Set:SensorValue to the device. This resets the sensor. This parameter can only be set. Its status cannot be received and thus it cannot be shown in the overview. |
Copy Cell To Clipboard |
Copies the currently selected cell [that is, single information] into the clipboard/temporary memory. [Keyboard shortcut: Ctrl + C] |
Copy Rows To Clipboard |
Copies the currently selected row or rows [that is, all parameter information] into the clipboard/temporary memory. [Keyboard shortcut: Ctrl + Shift + C] |
Export List... |
Saves the entire, currently shown list/view/table as a preformatted text file. |
The software will show you if sensors have reported serious or critical values.
If values are out of the optimal range, the entire row will be shown in the same color as would the status indicate:
- Sensor tolerated values [yellow to orange]
- Sensor minimum and maximum [red]
No visual changes are made to the row if values are within optimal range.


▪Search - Enter any text in order to search all parameters in the list.
- Any device/line that includes the search term will be shown. All others are temporarily filtered out.
- Terms can be case-insensitive. You don't have to use capital letters.
- Feel free to use terms that are incomplete. For example, mad will include results for MADRIX.
- You may specify certain columns by using a colon [:].
- For example: Sen:Temp shows all lines where a temperature sensor is connected by referencing the column Sensor, for example.
You can set up specific settings for Sensors in the Options.
Learn more »Timing
MADRIX RADAR allows you to choose which columns are presented in this view. You can decide which columns are hidden or shown.
▪Right Mouse Click - Perform a click with your right mouse button anywhere on the header of the list.
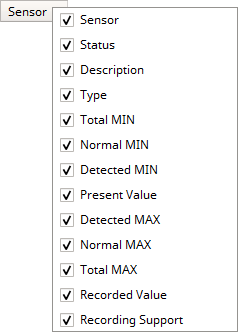
|
Shown - A checkmark means that columns are shown. |
|
Hidden - No checkmark means that columns are hidden. |
Sensor |
Shows or hides the Sensor column. |
Status |
Shows or hides the Status column. |
Description |
Shows or hides the Description column. |
Type |
Shows or hides the Type column. |
Total MIN |
Shows or hides the Total MIN column. |
Normal MIN |
Shows or hides the Normal MIN column. |
Detected MIN |
Shows or hides the Detected MIN column. |
Present Value |
Shows or hides the Present Value column. |
Detected MAX |
Shows or hides the Detected MAX column. |
Normal MAX |
Shows or hides the Normal MAX column. |
Total MAX |
Shows or hides the Total MAX column. |
Recorded Value |
Shows or hides the Recorded Value column. |
Recording Support |
Shows or hides the Recording Support column. |
Resize All Columns To Content |
Automatically adjusts the width of all columns to be wider or smaller to comfortably fit all list entries as well as column headers. [This often means that the size of columns is reduced and more information can be displayed in the given space.] |

