|
In this tutorial, you will learn how you can use the MADRIX PLEXUS as a DMX testing tool for input and output data.
Sometimes it is necessary to test DMX lines with and without fixtures inbetween. You might need to find an issue in the line. To do so, you can use a special DMX testing device or you can use the integrated DMX testing tool of MADRIX PLEXUS. The PLEXUS provides the possibility to monitor incoming data or outgoing data of its two DMX ports.
Date: 10/2014
PLEXUS Firmware Version: 1.8.5168 (Created with)
1.
|
Please connect MADRIX PLEXUS to power.
|
2.
|
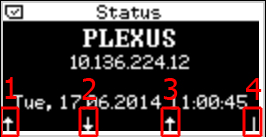
The menu Information > Status on the PLEXUs already provides useful information.
4 status symbols shown at the bottom indicate the status of the 4 ports at the bottom of MADRIX PLEXUS, including DMX 1, DMX 2, USB/Power, and Ethernet.
| • | An arrow from bottom to top means that the PLEXUS receives data on this port. |
|
| • | An arrow from top to bottom means the PLEXUS sends data to the port. |
|
| • | A line means that the PLEXUS neither sends nor receives data on the port. |
|
| • | An X means that there is currently no connection available at this port. |
|
In this example, the PLEXUS has the following status:
1
|
MADRIX PLEXUS receives DMX data on DMX 1.
|
2
|
MADRIX PLEXUS sends DMX data on DMX 2.
|
3
|
MADRIX PLEXUS receives data via USB.
|
4
|
MADRIX PLEXUS neither receives nor sends data via Ethernet.
|
|
3.
|
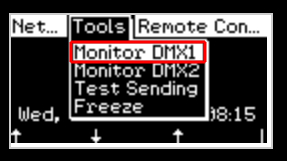
Now, please navigate to Tools > Monitor DMX 1 and open the monitor by pressing the OK key.
|
4.
|
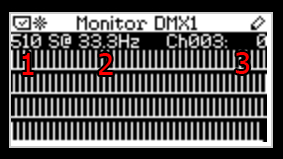
In the DMX Monitor of the PLEXUS, you can find the following information:
1
|
Shows the amount of DMX channels in the DMX universe that are currently used.
|
2
|
Shows the frame rate of the data. If the PLEXUS receives DMX data on this port, you will see the frame rate of incoming data.
|
3
|
Shows the current DMX value of the currently selected channel. You can change the channel with the left and right arrow keys. In the screenshot below, channel 3 is shown with a value of 0.
|
|
The screenshot below also graphically shows the current DMX values of the complete universe.
|
|
5.
|
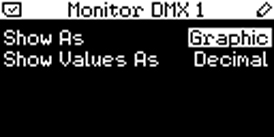
You can further change how the DMX Monitor looks and shows the data to you. To change it, press the OK key for 3 seconds. The PLEXUS will switch to the options page and you can change the following settings:
|
When the value for Show As is highlighted in white, you can choose between Graphic, Table, and Channel with the left and right arrow keys. In this example, we have chosen Graphic.
|
|
When the value for Show Values As is highlighted in white, you can choose between Decimal, Hexadecimal, and Percent with the left and right arrow keys. In this example, we have chosen Decimal.
|
|
Congratulations! You have learned to use the DMX Monitor function of MADRIX PLEXUS.
|